Er what kind of indicator is in advertising. ERday, ERpost, ERview - what is it? And what are they for? Arguments for and against ER
After numerous debates on the Internet and due to the lack of a common point of view, we decided to thoroughly analyze the question of how the coefficient (degree or level) of audience involvement should be calculated, which formula is the most correct and why.
To begin with, let's look at the basic definitions that can be useful and with which Engagement Rate is often confused:
Engagement Volume- total number of engagements (sum of all engagements).
Love Rate- number of likes in terms of audience size (total number of all likes/number of subscribers*100%).
Talk Rate- number of comments in terms of audience size (total number of all comments/number of subscribers*100%).
When calculating the average publication, add the number of entries to the denominator:
Reach- the number of people who had at least one contact with the publication (or advertisement).
Methods for calculating the level of involvement in foreign SMM
There is no consensus there either - most often they lean towards several basic formulas and definitions:
Engagement rate is a metric that measures the level (degree) of engagement that a certain piece of published content receives from the audience. *- https://trackmaven.com/marketing-dictionary/engagement-rate/
There are three main types of engagement rate: ER per day (daily engagement rate or ER day), ER per post (engagement rate or ER post) and ER per reach (engagement rate by reach or ERR). It is worth noting that foreign services and companies very rarely separate indicators by type: in one context they may call the ER post indicator a classic indicator, and in another - ERR, so when working on the service, we immediately began to separate these metrics so that there would be no confusion.
Types and meaning of different ER engagement indicators
Engagement rate by reach or ERR
The basic formula for one publication looks like this:
The final value will show the % of people who were active on a particular post.
Average ERR will show the average % of people who are interested in page posts among those who saw them.
One of the disadvantages of this indicator is that coverage data is available only to page administrators, and it will not be possible to calculate it without being related to the page (with the exception of open statistics data on some pages on VKontakte).
Another disadvantage is much more serious: coverage is a relative indicator. The numbers may change under the influence of various factors: time of day, viral potential of the post, the weight of the page for users on social networks with an algorithmic feed, and others.
For most cases, social networks do not separate reach from followers and total reach. In this case, a publication with sufficient viral potential (viral post), having gone beyond the community due to shares and ending up in the feed of their friends and subscribers, will receive greater coverage and relatively low involvement (relative to the overall coverage figure). As a result, the ERR percentage of the publication will fall.
In another situation, especially for social networks with an algorithmic feed, a post may appear in the feed of a very narrow part of the audience (this is most noticeable on the example of small pages) - only a couple of dozen people who are likely to be active, because initially interested in the content of this page. Then, with very low coverage, you will get a relatively high level of engagement.
As a result, when comparing the ERR of a viral post and the ERR of a post from the second situation, the engagement rate of the second will be noticeably higher.
Checking these conclusions is quite simple - you can download statistics of publications with coverage, calculate ERR and sort by this indicator. As a result of such an operation, objectively popular records will be far from being in the top.
Conclusions: engagement rate by reach is suitable in a situation where you need to estimate the approximate % of people who are active among those who viewed a post, but it is absolutely not suitable for comparing the quality of these publications, their popularity and will be biased when comparing different pages and their records.
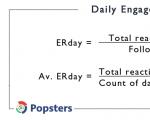
Daytime involvement(daily engagement rateorER day)
The basic formula for calculating ER day for a selected day or period is:

The final value will show, presumably, the percentage of people who were active during the day out of the number of subscribers.
“Presumably” because the conditions under which this metric is calculated do not take into account a sufficiently large error - like other ER indicators, each active subscriber could be active several times, only in the case of ERday such an error becomes more noticeable, because The activity of one person on different posts published on the same day will have a greater impact on the final value.
Another negative aspect of this metric is that the frequency of publications is not taken into account: if you want to increase ERday, just publish more posts (as long as the rule is followed: the more posts per day, the greater their total activity).
Conclusions: daily engagement will help you understand the approximate % of activity in relation to the number of subscribers, in other words, the “effective reach” (volume of engagement) of the page, but this indicator can hardly be considered more useful than the net volume of engagement when translated into % value (engagement volume).
Post engagement (engagement rate or ER post)
The basic formula looks like this:

The total shows the [average] % of people engaged in a particular [or average] post.
Unlike ERR, this indicator is based on the absolute value in the denominator - the number of subscribers, and will not differ dramatically from publication to publication. Thanks to this, high-quality and interesting publications will appear at the very top when sorted.
The disadvantage of this indicator is that as the number of subscribers increases, the overall percentage of engagement [relative to the total number of subscribers] decreases. This happens for various reasons: over time, interest in the page from the oldest subscribers may decrease, the number of other communities in their feed increases, and because of this, page posts are less likely to come to their attention, and others. In this regard, it is impossible to compare the ER of pages with radically different audience sizes without adjustment - you need to take into account the average indicators for pages of this size, and then make a comparison.
Conclusions: ER post will help you evaluate how interesting the publications are among the audience, compare posts and activity in different communities (with adjustments if the size of the audience varies greatly).
Other variations of Engagement Rate calculation
In their work, some companies and services use other options for calculating the ER indicator:
Engagement rate by views
The calculation is similar to the ERR calculation, but instead of coverage, the number of post views is used:
ER view = (Amount of engagement per post)/(Number of views)*100%
Average ER view = (Sum of ER views of all records in the analyzed period)/(Number of records in the analyzed period)
This variation of the indicator has the same disadvantages as ERR, but in addition to them a new one is added: the view indicator takes into account non-unique views of the audience, i.e. multiple views by each viewer are added together when the post is reopened, which can cause the performance of different posts to vary even more than ERR. For these reasons, we would not recommend using ERview for any qualitative assessment of community content.
Engagement with multipliers

In this case, a multiplier is added for different indicators of the post: this is justified by the fact that “a repost is a more significant sign than a like” or “account owners often respond to the comments of their subscribers,” after which the number of reposts is multiplied by 2 (3, 4 or another figure ), and the number of comments by 0.5 (halved).
As you can see, in all previous variations, ER is a % indicator of the audience size (or reach). So we can say:
ER Engagement Rate is a metric that reflects the % of the audience that is engaged in community events.
As a consequence, engagement rate with multipliers cannot be called ER, because with multiplication factors unequal to 1, the final figure will not show the % of the engaged audience. One could call such metrics some kind of “activity index” or “virality index,” depending on the multipliers used, but not the engagement rate.
Engagement per subscriber
This metric is almost identical to calculating the ER post indicator, only the final multiplier is not 100%, but simply 100. As a result, the metric shows not “% of the audience involved in publications”, but “the average number of reactions for every 100 subscribers”. Using this formulation, the minus common to % ER indicators is leveled - the possibility of having several reactions from the same subscribers, because There is no reference to audience size.
The problem with this option lies in the new formulation: the classic interpretation refers to the audience, the volume of which also needs to be taken into account, but in the new format this is not the case, which gives rise to the erroneous impression that this indicator is an absolute value and can be compared with each other for different pages without taking into account the size of the audience.
Conclusion

So what do the different indicators tell us and how can they be useful for assessment?
ER by coverage cannot be considered objective when assessing the quality of publications or comparing different pages with each other, because is a relative indicator. In our opinion, it is more correct to compare the reach on its own, or the “reach/number of subscribers” indicator, then you will see the approximate % of the audience that the page’s publications reach.
The ER day indicator is useful for assessing the engaged % of the audience as a whole, but it is worth remembering the negative aspects of this indicator, and it is definitely not suitable for assessing the quality of content.
The ER post metric turns out to be the most useful in practice - it will help evaluate and compare the popularity of different publications, and compare (with adjustments for different audience sizes) different pages with each other. Accordingly, if the goal of community management is to develop audience involvement, then it makes sense to look at the dynamics of this indicator for a page over different periods.
It is worth adding about two additional indicators - LR (Love Rate) and TR (Talk Rate). According to the calculation formula, they are almost identical to ER post, but in one case, the first metric focuses on the manifestation of “love” for the page’s publications, and the other on the sociability of subscribers. Using these indicators, you can compare pages by the degree of attractiveness of their posts or the level of sociability of the audience.
Useful articles to continue the topic:
- Methods;
- and how to increase it - a complete guide;
- Statistics and .
And in particular - about the engagement rate.
This KPI is a little more advanced than “number of followers.” Surprisingly, it has not yet become “standard”, and some authors understand it differently. In English, by the way, this is called “engagement rate” or “engagement ratio”; it is sometimes called ER for short.
In a general sense, the engagement rate should provide some measure of how engaged your page's audience is with what you post there. That is, if you constantly post something there, and no one from the audience reacts, then this is probably bad. You want what you write to somehow coincide with the aspirations of your audience? Accordingly, the engagement rate is calculated for this purpose.
There are two fundamentally different approaches to measuring engagement: either “by reach” (that is, by those people who saw the publication) or by “community base” (by group/page member).
Post engagement rate (by base) = the sum of likes, reposts, comments divided by the number of page subscribers (i.e. community base)
Roughly speaking, you have 100 subscribers. You publish a post. Someone liked it, someone reposted it, there were no comments. The sum of likes, comments and reposts will be = 2. Engagement rate (based on the database) = 2%.
Post engagement rate (by reach) = the sum of likes, reposts, comments divided by the number of those who saw this post (i.e. reach)
Let's say you have 100 subscribers. You posted something, 10 people (out of 100) saw it. And two liked something. Engagement rate (by reach) = 20%.
Which is correct? This is discussed in various ways in the SMM community. On the one hand, calculation based on the community base connects the final result with the initial action - that is, we threw something into a group with X number of subscribers and received such involvement. That is, this process is presented as a kind of “black box” - action at the input, result at the output. At the same time, the internal point is ignored, such as the fact that obviously not 100% of the group’s audience will see a certain post.
What do we want to see when we measure a post's engagement rate? — To what extent did this post reach the target audience? Accordingly, it should be measured by how many people from this audience were reached (saw the post), and not how many could have seen it at all. Therefore, to assess the quality of your own content, it is better to use the engagement rate by reach.
But the option of calculating engagement by database also has an advantage - it makes it easier to compare yourself with your competitors. After all, as a rule, you do not see what coverage a competitor’s post had, but you only see engagement actions and the base (how many subscribers the competitor has).
At the same time, there are important features.
Factors to keep in mind include your available audience, which usually depends on WHEN you published the post. In particular, if you write something, say, at 3 a.m. for a local audience, then it is clear that the majority are sleeping at this time, and when they wake up, your post will most likely be “clogged” at the top of the feed with more recent posts from other brands or the reader's friends. Accordingly, simply the opportunity to see the post will be less, and accordingly, the engagement in the database will most likely be less (but in terms of coverage it may be even better, because you published the post at a less competitive time, when it is more difficult to miss it against the backdrop of competing posts).
It is also important to compare posts of approximately the same categories. As an example, a post with a cat, and even on a company topic (for example, “cat dentist”) is guaranteed to get more engagement than a post about methods of treating any dental disease. You can complain about the injustice of the world, but it is so. But at the same time, if you run a dentistry page, you simply cannot turn the company page into a cat feed, your tasks are different.
Accordingly, using the engagement rate, you can compare posts of the same categories and see which one turned out to be “closer” to the audience. You can also compare, for example, posts of the same categories, but one had a picture and the other did not (and make sure that posts with pictures work better). Or check the influence of hashtags. And so on.
The average engagement rate of posts for a period (based on the database) = the sum of likes, reposts, comments divided by the number of posts for a given period, and after that - divided by the average number of subscribers for a given period.
Average post engagement rate for a period (by reach) = the sum of likes, reposts, comments divided by the number of posts for a given period, and after that divided by the average reach of a post for a given period.
This coefficient shows the success of work in a certain period (better/worse than the previous one or similar to last year). It's important to remember that this number is just a number, and there could be a lot of different explanations for it that need to be sorted out. How does seasonality affect this figure, or what you did (changed the format, frequency of posts?)
And the last thing for today -
Average page/group engagement rate for a period (based on the database) = the sum of likes, reposts, comments divided by the average number of subscribers for a given period
Average page/group engagement rate for a period (by reach) = the sum of likes, reposts, comments divided by the average reach for a given period
Note the absence of the word “post” or “posts” in the definition - this ratio really looks at, relatively speaking, what percentage of the audience “did something good” on your page over the period.
It is also important to understand that one person who liked two posts and two people who liked one post will give the same final coefficient. Therefore, sometimes this coefficient is calculated based on the engagement from a unique subscriber - that is, two or more “useful actions” from one person are counted as one.
How to increase your engagement rate?
In general, it depends of course on the quality of the content. The higher the quality of the content, the more people like, share, and comment on it.
However, there are a few simple tips for increasing engagement that virtually anyone can apply:
- Be sure to use pictures in your posts: such content is more noticeable than just text and causes more reactions.
- Try to respond to the “pains” or “wants” of your readers in your content.
- If someone asked a question under the post, be sure to write an answer. The comment tracking service will help with this.
- If someone wrote to you in Direct, also respond - you will earn a loyal client or subscriber, who will also help you increase your activity. There is a special service Smmotri.ru - to track Instagram Direct from your computer.
Did you like our article?. We freely share a lot of useful material. Even if you decide to promote on social networks yourself, our articles will make your life much easier.
Don't want to miss the next article?. This is much more reliable than, for example, liking us on social networks - this way links to recent articles are guaranteed to end up in your inbox, and not hidden somewhere in your feed.
No similar articles
ER ( Engagement Rate - level of interaction ) is an indicator that reflects the level of audience interaction with your publications. The higher the ER, the more interesting the posts are to your subscribers and they express this in the form of likes and comments. Simply put, if you have 20,000 subscribers and posts get 20-30 likes, this is not good.
In this material, we will talk about what formula for calculating ER to use, tell you what the engagement indicator affects, and share recommendations for improving it.
Formula for calculating ER
For different social networks, ER can and should be calculated differently. And on Instagram there are many formulas for calculating ER. Therefore, it is incorrect to compare the ER indicators of different services, since they may use different algorithms.
Let us describe several basic approaches to calculating ER.
One of the most popular approaches is calculating ER per post. Or the average level of engagement per post. The formula looks like this:
ER = (likes + comments) / subscribers * 100%.
For example, you have 1000 subscribers, and your last post received 90 likes and 10 comments. It turns out, ER = (90 + 10) / 1000 * 100% = 10%. Accordingly, to calculate the ER of the entire account, you need to add up the ER for each post and divide by the total number of posts. Most often, not all posts are taken into account, but the last 10-20 or all posts for the last month.
The data is visible under each post for those who switched to .

Another formula that is popular when calculating ER, instead of the number of subscribers, takes into account the reach that the post received.
ER = (likes + comments) / reach per post * 100%.
This method of calculation can be considered more accurate, since not all subscribers see new publications, and the coverage reflects exactly those who did. For example, with all the same indicators as in the previous example, we will not divide by 1000 subscribers, but by coverage, let’s say it was 400. It turns out, ER = (90 + 10) / 400 * 100% = 25%. Even for 1000 subscribers this is a very high figure. With further account growth, the indicator will decrease and this is normal.
What ER is considered normal?
The more subscribers, the lower the ER and this is, in principle, a normal phenomenon. All this happens due to the fact that Instagram purposefully pessimizes posts so that users are motivated to launch . It is possible that profiles that are transferred to a business account, which indicates a clear commercial component, receive pessimization to an even greater extent (but this is not certain).
But here one more factor needs to be taken into account - the level of reach of the audience. It can be roughly divided into 4 groups:
- users with no more than 500 subscriptions. They see your publications more often than others;
- subscribers with the number of subscriptions from 500 to 1000. Sometimes they can see your publications;
- the number of subscriptions a user has is from 1000 to 2000. You will be very lucky if your publication is noticed;
- more than 2000. As a rule, these are business accounts that followed you using mass following. They don't watch their feed at all. If there is no mutual subscription, they will be deleted later.
It turns out that the more subscribers you have of users with a small number of outgoing subscriptions, the higher the quality of your audience and the more often they will see your posts. Related article: .
Based on this, accounts with different subscription bases will have different ER indicators (calculated according to the second principle). For example, for an account with 5,000 to 10,000 subscribers, the normal figure is 10-20%; for accounts with over 10,000 subscribers, this figure usually drops to 5%; anything over 100,000 is 3%; and accounts with millions of subscribers are down to 1%.
Again, these indicators should not be considered as the ultimate truth. Instagram is changing very rapidly, so the algorithms are changing, and each account is a separate case that needs to be considered individually.
How to increase ER
We need to act in this direction by improving the quality of content and the quality of the audience. But again, there is no single algorithm by which ER can be increased; each situation is individual in its own way. Here is a list of basic recommendations:
- Assess your current situation. Check what your ER indicator is now, whether you or the agency that guides you are doing it to increase likes on posts, how many bots you have in your subscribers, how often you publish new content.
- Identify the problem: low coverage or low ER relative to coverage.
- Experiment with new content - try different options. Try to take photos that you want to discuss, write text so that it evokes a response.
- . Follow the link to find out how to do this using the SocialKit program.
- Gathering a target audience on Instagram - gather the hottest and most active audience who likes to like and comment and start boosting followers on them. Filter out those who are unlikely to see your posts (exclude those with more than 1,000 outgoing subscriptions).
- Don't use the same hashtags on different posts.
- Use only original content - the one you create yourself. You should not copy both images and text. The same applies to reposts from public pages.
- Do not place text on the photo. Even in advertising, Instagram will show posts with text on the image to a smaller number of audiences, not to mention organic.
And most importantly, read our blog and use the SocialKit program for working on Instagram.

As you know, engagement on Instagram affects the ranking of posts in the feed. The higher the engagement, the higher your posts appear. The higher they are, the more users will see them.
In this article we will tell you how to calculate engagement on Instagram and how you can increase your ER. Many of the tips can be implemented within 10-15 minutes.
What is ER on Instagram and what indicator can be considered good?
The abbreviation ER stands for Engagement Rate and is translated as engagement coefficient. The indicator is calculated as a percentage and serves as an indicator of audience activity on the Instagram page.
In simple terms, how actively your subscribers and the audience you reach react to your posts. An active reaction is considered to be:
- like;
- comment;
- repost;
- saving the post to bookmarks.
At the same time, there is no exact value for what ER indicator can be considered good. It all depends on the size of the audience. For an account with up to 10,000 subscribers, an ER of 10% would be good; for a page with an audience of more than 1,000,000, 1% would be normal. It is also worth considering whether the account is commercial or personal. Commercial pages have correspondingly lower engagement.
How to calculate ER on Instagram
There are 2 methods of calculation: based on the number of followers (ER) and based on the reach of the publication ( ERViews - Engagement Rate Views). When analyzing the effectiveness of promotion on Instagram, both indicators should be taken into account.
E.R. It is calculated as the ratio of the average number of all interactions on posts to the number of subscribers over a certain period of time. It is important to count to understand the loyalty of your subscribers. The downside is that the reaction of other users who saw the publication is not taken into account.
- Calculation example: in a month on an account with 1000 subscribers, we published 30 posts, which received a total of 2000 likes and 100 comments. It turns out 2000+100/30 = 70 reactions to the post. Accordingly, ER, 70 reactions per post/1000 subscribers * 100% = 7% .
ERViews. It is calculated in the same way as ER, only instead of the number of subscribers, the average reach for one post is taken. Shows the level of interest of all the audience who saw the post. Including hashtags, recommendations, etc.
- Calculation example: Same input as in the example above. The average reach of each post is 500 unique users. It turns out ERViews = 70 reactions per post/500 average post coverage * 100% = 14% .
How to increase impressions and engagement on Instagram
Ask for feedback
Subscribers appreciate it when their opinions are taken into account. Especially if leaving a comment does not require spending a lot of time and studying additional information. Ask simple questions directly in posts, for example:
- Ask if it's worth running a promotion with discounts, or if it's better to give small souvenirs instead
- Find out what subscribers think about the latest sensational event
- Describe the situation in detail and ask for advice
- Ask any topical question - for example, ask how subscribers feel about sex on the first date or what was the first thing they saw this morning
Select the type of feedback based on the features of your account. For example, a question about attitudes towards a certain event would be appropriate for a blogger, and a survey about a promotion would be appropriate for small business accounts.
This is how you can ask subscribers to give feedback
Run a comment contest
If you have something to offer your subscribers as a prize, hold a comment contest. Its mechanics are extremely simple: everyone who left a comment under a certain post participates in the drawing, and the winner can be chosen at random or using special applications - for example, the serviceGiveaway.
To maximize engagement, you can ask users not only to write a comment, but also to like or follow the account. A good way to increase your reach is to ask contest participants to tag two of their friends in the comments under the post.
 The conditions and mechanics of the competition are well defined here.
 Hold a competition for the most active subscriber
Being active is more difficult than leaving a short comment or answer to a question in a post. Therefore, the prizes in such a competition should be more serious than in a regular drawing: for example, give the most active subscriber a 50-70% discount, jewelry or a travel certificate. The more valuable the prize, the more active the participants will be.
Activity can be expressed in different ways. For example, ask subscribers:
- Like
- Leave comments
- Tag friends in the comments
Clearly state by what indicator the winner will be chosen - for example, the winner will be the one who left the most likes or scored the most points in total. And special services will help you see accurate statistics, for example -Giweawation.
 Example of an activity competition
 Find the perfect time to post
Just publish posts at the right time - then a large number of subscribers will see them, which means the likelihood of getting likes and comments will increase significantly. You can calculate the right time yourself - to do this, look at posts for a week, month or year, and collect statistics.
Or take a simpler route - use special services, for example,Popsters. It shows the success of a post made at a certain time in relation to all posts. Generates the result as a percentage and builds a schedule of successful times for releasing new posts.
 The most successful time in the example under consideration is 20:00 hours
 Get rid of bots
The engagement rate on Instagram is formed based on statistics for all followers of your account. To increase ER, you can simply get rid of those who spoil the statistics - bots and inactive accounts. You can find them manually, but this will take a lot of time, or using services:
- SpamGuard;
- Instaplus.pro;
- SocialKit.ru;
- OneMillionLikes.
Using the same services, you can remove inactive subscribers, bots and mass followers from the list. But we recommend doing this in several stages, clearing your account of inactive users gradually. If you remove all bots at once, your organic reach may drop significantly.
 This is what creating a cleaning task looks like in Instaplus
 Announce posts in Stories
Instagram stories are published at the top of the feed, so they receive more views compared to regular posts. You can attract the attention of subscribers by publishing in Stories, namely, by announcing the upcoming post. For example, tell your story that you will be posting soon with:
- Description of a new product or service;
- Drawing of valuable prizes;
- Own research;
- Useful infographics.
The main thing is that the upcoming post is useful to the target audience. Then your subscribers will follow updates in your account, which means your engagement rate will increase.
 Announcement example
 Provoke discussions
Bring up the “hype” topic that is being discussed. Ask your subscribers for their opinions and enjoy the results in the comments. For example, you can cover a high-profile political news story or discuss a bill that has created a stir in the media. You can also use regional news that has caused public outcry.
 The account owner played well on the topic under discussion - the 2018 Presidential elections
 Hold a flash mob
A flash mob in its pure form will not help increase engagement on Instagram. In order for people to visit your account, like and leave comments, you need to ask the flash mob participants to mention the link to your account in the post. Then many of its participants, being your th target audience, they will go to your profile, perhaps subscribe and like. This will increase your ER in the short term, and our other tips will help you keep it at a high level.
Depending on the specifics of your account, you can come up with different ideas for a flash mob, for example, ask participants to:
- Find an original way to use your product, photograph it in action and post the photo
- Create a simple picture mentioning your company in any editor and pass the baton to several friends
- Ask them to share why followers follow any of their friends, and pass the baton to the next participant
The mechanics of a flash mob are quite complex. You will have to think about how you can attract subscribers so that they want to start the relay race, and how you can attract followers and increase ER through publications.
 Flash mob from Oriflame gained more than 2,000 participants
 So what can you do to increase ER:
- Ask for feedback - an answer to a question, a story about a product, an opinion about a situation;
- Hold a comment competition;
- Hold a competition for the most active subscriber;
- Find the ideal time to post using Instagram statistics or third-party services;
- Get rid of bots manually or using special services;
- Announce upcoming useful or interesting posts in Stories;
- Provoke discussion with a “hype” topic;
- Hold a flash mob.
How do you work with the engagement rate and does it help you increase your organic reach and attract new subscribers? Share your opinion in the comments - we are very interested!
Speaks: Aygun Kurbanova- HR Director at Neotek
The Deputy General Director returned from an international conference and spoke about the speech of one of the speakers. He argued: there is a direct connection between employee involvement in business processes and profit. In those companies with an engagement index of 60% or more, profits are higher than those of competitors. This conclusion follows from a study by Gallup Media. Impressed by this fact, the company's management instructed the HR director to calculate an employee engagement index.
The meaning and purpose of such an order are obvious: the company’s management intends to understand whether employees are sufficiently involved in the life and affairs of the company, and therefore whether there are reserves for increasing the profitability of the company by increasing employee involvement. The HR director, of course, understands that it will be necessary to conduct a survey of company employees. But how to calculate the engagement index? How to approach this task?
In order not to reinvent the wheel, the HR Director instructed the assessment manager to familiarize himself with the methods developed by well-known companies - Gallup Media, Aon Hewitt, Hay Group - and select the appropriate ones. They should not be overly complex, requiring those conducting them to have special training. But even completely primitive and unprofessional ones should be discarded. After analyzing the available methods, the assessment manager told his manager about them, and he settled on two. One technique allows you to quickly and relatively easily measure the level of employee involvement in the company's affairs and calculate its index. Another technique involves a more thorough approach: you need to divide engagement into three components, first obtain indicators for each component, and then sum them up and derive an index.
Speaks: Anna Parshina- Director of the Employee Happiness Department at Enter
The engagement index depends on impressions and emotions at work. Give them to your employees!
When we launched a federal retail chain, in addition to high professionalism, healthy adventurism and ambition, and self-confidence, the team of specialists also required fantastic commitment! With the help of classic motivators - career growth, high salaries, a good workplace - it is impossible to achieve this from 27-year-old guys. They need something more - emotions, a sense of drive, thanks to which people work hard and with pleasure, feel a sense of joy and pride. We regularly organize unusual promotions and events that evoke vivid emotions and make working in the company interesting. This is part of our corporate culture. According to AXES Management, Enter's engagement rate was 74% last year. And the project “Emotions at Work” was awarded bronze at the “HR Brand 2012”.
Quick and relatively easy: express analysis of engagement using the Q12 method
The basis of the methodology is a questionnaire containing 12 statements. Study them, adjust if necessary, and then distribute the questionnaire to employees and ask them to rate whether each statement is true. You just need to mark: “Yes” or “No”.
After employees fill out the questionnaires, collect them and begin the calculations. First, determine how many positive and how many negative answers there are in each questionnaire, and then add up the number of “Yes” answers in all questionnaires.
Do the same with “No” answers. This way you will get an overall picture of the company and will immediately see which answers are most numerous. But that's not all. Convert the number of positive responses to percentages. Take the total sum of all answers for the company (both negative and positive) as 100%, and then, having made an elementary proportion, calculate what percentage are positive answers. This is the percentage of engagement.
Example
The trading company employs 400 people. 297 people took part in the survey to determine the level of employee involvement in the life of the company.
The positive responses given by these employees were 2,743. To calculate the engagement rate, the evaluation manager first obtained the total number of all responses (both positive and negative) that the employees gave. To do this, he multiplied the number of people who took part in the survey by the number of questions in the questionnaire (12): 297 x 12 = 3564. Then the personnel evaluator calculated the actual percentage of engagement using the principle of proportion and based on the number of correct answers: 2743 x 100 (%): 3564 = 77%.
How to understand how good the engagement rate obtained using the Q12 method is
We can talk about a high level of involvement if the positive responses are 70%. This is quite possible. At Enter, for example, staff engagement reaches 81%. If the positive responses are 50% or less, this is an alarming signal. Most likely, the company employs people who do not care what happens there. They are indifferent to its business goals, perform their duties automatically, without worrying about quality. If there are 60% positive answers, this is a satisfactory result. But it is bad because, in fact, it is a borderline indicator. And if you measured engagement for the first time, it is not clear what this indicator signals - that people will soon completely lose interest in work or, on the contrary, that this interest is growing and employees will become more actively involved in business processes.
When calculating employee engagement, follow six rules
1. Use the same questionnaires every time.
2. Conduct surveys regularly - once a year.
3. Make the survey anonymous - the answers will be truthful.
4. Compare data with labor productivity, turnover, and staff absenteeism levels.
5. Form the final engagement index not only for the entire company, but also for departments.
6. Automate the survey as much as possible to speed up the processing of questionnaires.
Involve at least 50% of employees in the survey, and completely different ones
If you can convince 100% of your employees to complete the surveys, that will be ideal. But this is hardly possible. Therefore, the acceptable minimum is 50% of the total number of employees in the company. Make sure that this 50% includes employees from different departments. And not only ordinary people, but also leaders. In addition, make sure that those completing the questionnaire include people of different ages and genders. Then the picture will be comprehensive and balanced.
After all, for example, executives, by definition, have a higher level of involvement: they have access to a larger amount of information, they influence the company’s policies and decisions. It would be wrong to involve only managers in the survey, just as it would be wrong to give questionnaires only to ordinary employees.
Another fact: studies show that young people under 35 are always less involved in company affairs than their older colleagues. Moreover, this is typical for all countries: the younger generation is everywhere indifferent to work, and if possible, they are happy to not work at all. Therefore, if only the younger generation is involved in the survey, the results will be incorrect.
Speaks: Mikhail Rozin- Director of Human Resources of the Ronova Group of Companies
By calculating the engagement index, we understood why staff turnover is high and reduced it
We calculate the engagement index every year when we conduct staff assessments. At the beginning of last year, production staff turnover was 35%. By calculating the engagement index, we understood the reason. The company has an opaque motivation system, a high level of stress, a narrowly targeted social package, some training programs are outdated, and there are no clear plans for personnel development. We took measures: we changed the principle of forming a fixed part of the salary, introduced quarterly bonuses for the quality of work, and for agents - for attracting a new client. Managers whose work involves traveling were given subsidies for food. In addition, we changed the training program for production personnel and created a training matrix depending on the position level. At the end of the year, we saw that turnover had decreased.
In more detail: we calculate the engagement index based on its three components
Involvement is a complex indicator that reflects the state of the company’s corporate culture and the degree to which staff care about their work.
I suggest using the three most important indicators of engagement. The first: involvement in the work process, the second - participation in processes to optimize work, in company management, the third indicator - response to an offer to participate in corporate promotions and events.
The logic of your actions should be as follows: first measure engagement for each component (indicator), and then bring the results together, sum them up and get an index.
We measure involvement in the work process: how the employee feels about what he is doing
Does he show interest in his activities and strive to carry out orders as best as possible? If the answer is yes, then the specialist, on his own initiative, will stay late at work to complete the task and, if necessary, discuss it with colleagues. A person involved in the work process is able to independently set priorities and will never say: “I did what you said. Give me another task." He knows what and how to do.
Example
The head of the sales department once asked whether sales managers track how customers pay off their debt for a product if they bought it in installments.
The subordinates looked at the leader in bewilderment, and he realized that they were not tracking. It was like a bolt from the blue. The head of the department didn’t even realize that he had to remind the sales specialists about this. When he checked the payments, he saw that many customers had already fallen behind on their payments more than once. In fact, they use part of the product for free, but managers don’t care. The head of the department contacted the HR department. Its specialists conducted a survey and observed the behavior of employees. The result: employees are not involved in work and are indifferent to it. Six months later, the entire composition of the sales department was replaced, and there were no late payments, as well as other outright violations caused by indifference.

To understand how involved each employee is in their work, conduct a survey (see page on the left). Ask employees to note whether each of the statements in the questionnaire corresponds to the actual state of affairs in the company. For each employee answer, a certain number of points are awarded.
Having calculated the overall score for each specific questionnaire, now display it for the entire company. This will be the arithmetic average: add up the indicators of all employees and divide the sum by the number of indicators. Record this number.
Speaks: Ekaterina Shanaeva- Head of HR Department CORSOCOMO
We measure the engagement index using a questionnaire that consists of six blocks
These blocks are: relationships in the team; the total remuneration of each employee (does it correspond to his qualifications); the company's prestige as an employer; content and criteria for evaluating work; opportunities that the company provides to employees for professional and career growth; quality of office life – organization of office space and a sense of work-life balance.
How involved are employees in optimization processes and company management?
Essentially, we determine whether employees respond to management’s proposals (and the efforts they make) to offer ideas for improving business processes, simplifying and speeding up work, and whether they seriously take calls to offer their own solutions to certain important projects. This is the second indicator of engagement.
Highlight key projects to improve business processes (or simply tasks to optimize production) that are carried out in your company, formulate them in the form of personal statements (as if the employee were saying them in the first person) and include them in the questionnaire.

As with the questionnaire used to measure work engagement, calculate the total score for each questionnaire completed by the employee. Then get the arithmetic average for the entire company: sum up the scores for all questionnaires and divide by the number of questionnaires. Record the result.
Speaks: Natalia Bisheva- ex-director of personnel at the DEMEU Technical Competence Center
Interview different categories of personnel. Based on the results, you can improve your motivation system
The survey results will be correct if different categories of employees participate in it. This means that you will be able to develop and take adequate and effective measures to improve the situation with engagement. Thus, in 2011, we surveyed 69% of all working personnel. Moreover, they also attracted new workers who had just completed their probationary period. In 2012, on behalf of management, we studied the opinions of valuable employees who made the greatest contribution to the company over the previous two years. In 2013, head office employees were surveyed.
After analyzing the results, we developed three programs: increasing company loyalty, introducing various forms of non-material incentives and a system of paying bonuses and bonuses. This will increase employee income. We are now implementing the system and the first positive results have already been obtained.
We find out whether employees actively participate in corporate events
If employees are reluctant to go to events that the company organizes for them, it means that they perceive these events as an extra burden, as something burdensome. Consequently, they are not involved in the general affairs of the company. An event is considered failed if less than 50% of employees participate. Whether employees want or don’t want to go to corporate events, whether they feel like one team, check using a questionnaire.
After calculating the total score for each questionnaire, do not forget to derive the arithmetic average for this component of involvement - “Participation in corporate events and activities” - for the entire company. Record the result.
Final step: calculate the overall engagement index
This is not difficult to do. Just sum up the arithmetic averages that you received for each of the three indicators of engagement - involvement in the work process, in making management decisions and optimizing business processes, as well as in participation in corporate events and promotions.
Example
The personnel assessment manager recorded the overall arithmetic average for the company for each of the three engagement indicators. Thus, according to questionnaires, the overall score for involvement in the work process was 25, for questionnaires to identify the degree of employee participation in process optimization and company management - 13, and for the third indicator (“participation in corporate events”) - 11. Thus, the engagement index personnel – 49 points (25 + 13 + 11).
How do you know if the index is high or low? Compare it with the indicators of the scale compiled by experts. They identified three levels. The first is from 0 to 30 points. This is a low level. From 31 to 60 points – average. Above 60 points – high. If engagement reaches 90 points, this is the highest result.