Installing and configuring WinDBG for analyzing memory dumps. Windows Debugging Tools: diagnosing and fixing BSOD Debugging tools for windows use
When a critical failure occurs, the Windows operating system crashes and displays a Blue Screen of Death (BSOD). Content random access memory and all information about the error that occurs is written to the swap file. Next time booting Windows a crash dump is created c debugging information based on stored data. A critical error entry is created in the system event log.
Attention! A crash dump is not created if the disk subsystem fails or a critical error occurs during the initial stage of Windows boot.
Types of Windows Crash Dumps
Using the current operating system Windows 10 as an example ( Windows Server 2016) consider the main types of memory dumps that the system can create:
- Mini memory dump(256 KB). This file type contains a minimal amount of information. It only contains the BSOD error message, information about the drivers, the processes that were active at the time of the crash, and which process or kernel thread caused the crash.
- Kernel memory dump. Typically small in size—one third of the physical memory size. A kernel memory dump is more detailed than a mini dump. It contains information about drivers and kernel-mode programs, includes memory allocated to the Windows kernel and the hardware abstraction layer (HAL), and memory allocated to drivers and other kernel-mode programs.
- Complete memory dump. The largest in size and requires memory equal to your system's RAM plus the 1MB required by Windows to create this file.
- Automatic memory dump. Corresponds to a kernel memory dump in terms of information. The only difference is how much space it uses to create the dump file. This file type did not exist in Windows 7. It was added in Windows 8.
- Active memory dump. This type eliminates elements that cannot determine the cause of a system failure. This was added to Windows 10 and is especially useful if you are using a virtual machine, or if your system is a Hyper-V host.
How to enable memory dumping in Windows?
Using Win+Pause, open the system settings window, select " Extra options systems"(Advanced system settings). In the " Additionally" (Advanced), section "" (Startup and Recovery) click the button " Options"(Settings). In the window that opens, configure actions to take when the system fails. Check the " Log events to system log" (Write an event to the system log), select the type of dump that should be created when the system crashes. If in the checkbox " Replace existing dump file"(Overwrite any existing file) check the box, the file will be overwritten every time there is a failure. It’s better to uncheck this box, then you will have more information for analysis. Also disable Automatically restart.
In most cases, a small memory dump will be enough to analyze the cause of the BSOD.

Now, when a BSOD occurs, you can analyze the dump file and find the cause of the failure. The mini dump is saved in the %systemroot%\minidump folder by default. To analyze the dump file, I recommend using the program WinDBG(Microsoft Kernel Debugger).
Installing WinDBG on Windows
Utility WinDBG included in " Windows 10 SDK"(Windows 10 SDK). .
The file is called winsdksetup.exe, size 1.3 MB.
Run the installation and choose what exactly you want to do - install the package on this computer or download it for installation on other computers. Let's install the package on the local computer.

You can install the entire package, but to install only the debugging tool, select Debugging Tools for Windows.

After installation, WinDBG shortcuts can be found in the start menu.
Setting up association of .dmp files with WinDBG
To open dump files with a simple click, map the .dmp extension to the WinDBG utility.
- Open command line as administrator and run the commands for a 64-bit system: cd C:\Program Files (x86)\Windows Kits\10\Debuggers\x64
windbg.exe –IA
for 32-bit system:
C:\Program Files (x86)\Windows Kits\10\Debuggers\x86
windbg.exe –IA - As a result, the file types: .DMP, .HDMP, .MDMP, .KDMP, .WEW will be mapped to WinDBG.

Setting up a debugging symbol server in WinDBG
Debugging symbols (debug symbols or symbol files) are blocks of data generated during the compilation of a program together with the executable file. Such data blocks contain information about variable names, called functions, libraries, etc. This data is not needed when executing the program, but is useful when debugging it. Microsoft components are compiled with symbols distributed through the Microsoft Symbol Server.
Configure WinDBG to Microsoft use Symbol Server:
- Open WinDBG;
- Go to menu File –> Symbol File Path;
- Write a line containing the URL for downloading debugging symbols from the Microsoft website and the folder for saving the cache: SRV*E:\Sym_WinDBG*http://msdl.microsoft.com/download/symbols In the example, the cache is downloaded to the E:\Sym_WinDBG folder, you can indicate any.
- Don't forget to save changes to the menu File–>Save WorkSpace;
WinDBG will search for symbols in the local folder and, if it does not find the necessary symbols in it, it will automatically download the symbols from the specified site. If you want to add your own symbols folder, you can do it like this:
SRV*E:\Sym_WinDBG*http://msdl.microsoft.com/download/symbols;c:\Symbols
If you do not have an Internet connection, first download the symbol package from the Windows Symbol Packages resource.
Analysis of a crash dump in WinDBG
The WinDBG debugger opens the dump file and downloads the necessary symbols for debugging from a local folder or from the Internet. You cannot use WinDBG during this process. At the bottom of the window (in the debugger command line) the message appears Debugee not connected.
Commands are entered into the command line located at the bottom of the window.

The most important thing to pay attention to is the error code, which is always indicated in hexadecimal and has the form 0xXXXXXXXX(indicated in one of the options - STOP: , 07/02/2019 0008F, 0x8F). In our example, the error code is 0x139.
The debugger offers to run the command!analyze -v, just hover your mouse over the link and click. What is this command for?
- It performs preliminary memory dump analysis and provides detailed information to start analysis.
- This command will display the STOP code and symbolic name of the error.
- It shows the stack of command calls that led to the crash.
- In addition, IP address, process and register faults are displayed here.
- The team can provide ready-made recommendations to solve the problem.
The main points that you should pay attention to when analyzing after executing the command!analyze –v (listing incomplete).
1: kd> !analyze -v
* *
* Bugcheck Analysis *
* *
*****************************************************************************
Symbolic name of STOP error (BugCheck)
KERNEL_SECURITY_CHECK_FAILURE (139)
Description of the error (A kernel component has corrupted a critical data structure. This corruption could potentially allow an attacker to gain control of this machine):
A kernel component has corrupted a critical data structure. The corruption could potentially allow a malicious user to gain control of this machine.
Error arguments:
Arguments:
Arg1: 0000000000000003, A LIST_ENTRY has been corrupted (i.e. double remove).
Arg2: ffffd0003a20d5d0, Address of the trap frame for the exception that caused the bugcheck
Arg3: ffffd0003a20d528, Address of the exception record for the exception that caused the bugcheck
Arg4: 0000000000000000, Reserved
Debugging Details:
------------------
The counter shows how many times the system crashed with a similar error:
CUSTOMER_CRASH_COUNT: 1
DEFAULT_BUCKET_ID: FAIL_FAST_CORRUPT_LIST_ENTRY
STOP error code in shortened format:
BUGCHECK_STR: 0x139
The process during which the failure occurred (not necessarily the cause of the error, just at the time of the failure this process was running in memory):
PROCESS_NAME: sqlservr.exe
Error Code Description: The system has detected a stack buffer overflow in this application, which could allow an attacker to gain control of this application.
ERROR_CODE: (NTSTATUS) 0xc0000409 - The system detected an overrun of a stack-based buffer in this application. This overrun could potentially allow a malicious user to gain control of this application.
EXCEPTION_CODE: (NTSTATUS) 0xc0000409 - The system detected an overrun of a stack-based buffer in this application. This overrun could potentially allow a malicious user to gain control of this application.
Last call on the stack:
LAST_CONTROL_TRANSFER: from fffff8040117d6a9 to fffff8040116b0a0
Call stack at the time of failure:
STACK_TEXT:
ffffd000`3a20d2a8 fffff804`0117d6a9: 00000000`00000139 00000000`00000003 ffffd000`3a20d5d0 ffffd000`3a20d528: nt!KeBugCheckEx
ffffd000`3a20d2b0 fffff804`0117da50: ffffe000`f3ab9080 ffffe000`fc37e001 ffffd000`3a20d5d0 fffff804`0116e2a2: nt!KiBugCheckDispatch+0x69
ffffd000`3a20d3f0 fffff804`0117c150: 00000000`00000000 00000000`00000000 00000000`00000000 00000000`00000000: nt!KiFastFailDispatch+0xd 0
ffffd000`3a20d5d0 fffff804`01199482: ffffc000`701ba270 ffffc000`00000001 000000ea`73f68040 fffff804`000006f9: nt!KiRaiseSecurityCheckFailure+0x3d0
ffffd000`3a20d760 fffff804`014a455d: 00000000`00000001 ffffd000`3a20d941 ffffe000`fcacb000 ffffd000`3a20d951: nt! ?? ::FNODOBFM::`string"+0x17252
ffffd000`3a20d8c0 fffff804`013a34ac: 00000000`00000004 00000000`00000000 ffffd000`3a20d9d8 ffffe001`0a34c600: nt!IopSynchronousServiceTail+0x379
ffffd000`3a20d990 fffff804`0117d313: ffffffff`fffffffe 00000000`00000000 00000000`00000000 000000eb`a0cf1380: nt!NtWriteFile+0x694
ffffd000`3a20da90 00007ffb`475307da: 00000000`00000000 00000000`00000000 00000000`00000000 00000000`00000000: nt!KiSystemServiceCopyEnd+0 x13
000000ee`f25ed2b8 00000000`00000000: 00000000`00000000 00000000`00000000 00000000`00000000 00000000`00000000: 0x00007ffb`475 307da
The code section where the error occurred:
FOLLOWUP_IP:
nt!KiFastFailDispatch+d0
fffff804`0117da50 c644242000 mov byte ptr ,0
FAULT_INSTR_CODE: 202444c6
SYMBOL_STACK_INDEX: 2
SYMBOL_NAME: nt!KiFastFailDispatch+d0
FOLLOWUP_NAME: MachineOwner
The name of the module in the kernel object table. If the analyzer was able to detect problematic driver, the name is displayed in the MODULE_NAME and IMAGE_NAME fields:
MODULE_NAME:nt
IMAGE_NAME: ntkrnlmp.exe
1: kd> lmvm nt
Browse full module list
Loaded symbol image file: ntkrnlmp.exe
Mapped memory image file: C:\ProgramData\dbg\sym\ntoskrnl.exe\5A9A2147787000\ntoskrnl.exe
Image path: ntkrnlmp.exe
Image name: ntkrnlmp.exe
InternalName: ntkrnlmp.exe
OriginalFilename: ntkrnlmp.exe
ProductVersion: 6.3.9600.18946
FileVersion: 6.3.9600.18946 (winblue_ltsb_escrow.180302-1800)

In the example given, the analysis pointed to the kernel file ntkrnlmp.exe. When memory dump analysis points to a system driver (such as win32k.sys) or a kernel file (as in our example ntkrnlmp.exe), it is most likely this file is not the cause of the problem. Very often it turns out that the problem lies in the device driver, BIOS settings or equipment malfunction.
If you see that the BSOD was caused by a third-party driver, its name will be indicated in the MODULE_NAME and IMAGE_NAME values.
For example:
Image path: \SystemRoot\system32\drivers\cmudaxp.sys
Image name: cmudaxp.sys
Open the properties of the driver file and check its version. In most cases, the problem with drivers is solved by updating them.
on June 22, 2010
Previously Windbg was available separately to download. But for the latest versions, Microsoft keeps it as part of Windows SDK. Please find the download links below.
Windows 10
The latest version of Windbg for Windows 7 can be downloaded from the link https://developer.microsoft.com/en-us/windows/downloads/windows-10-sdk
Windows 7
Download installers from the above links. Note that this does not download the whole SDK, it’s just an installer. Once you run the file, you can select which tools you would like to be downloaded. If you are interested only in Windbg, you can exclude everything else and only select ‘Debugging tools’ under ‘Common Utilities’
The above package installs windbg 6.12 version. If you want to quick install windbg, you can go for older version(6.11) which can be downloaded from
the link given at the end of this post.
Once you do the installation, you can find the program in Start Menu -> All Programs -> Debugging Tools for Windows -> Windbg
Introducing WinDBG - Part 1
Alexander Antipov
WinDBG is an excellent debugger. It may not have a very user-friendly interface and doesn't have a black background by default, but it is one of the most powerful and stable debuggers on Windows OS currently. In this article, I'll introduce you to the basics of WinDBG so you can get started with it.
WinDBG is an excellent debugger. It may not have a very user-friendly interface and doesn't have a black background by default, but it is one of the most powerful and stable debuggers on Windows OS currently. In this article, I'll introduce you to the basics of WinDBG so you can get started with it.
This is the first article in a series dedicated to WinDBG. List of all articles included in this series:
- Part 1 – installation, interface, symbols, remote/local debugging, help system, modules, registers.
- Part 2 – breakpoints.
- Part 3 – memory inspection, step-by-step program debugging, tips and tricks.
In this article we will look at installation and attaching to a process, and in the following articles we will look at breakpoints, step-by-step debugging and memory inspection.
Installing WinDBG
Compared to Windows 7, the WinDBG installation process in Windows 8 has undergone minor changes. In this section we will look at installing a debugger for both operating systems.
Installing WinDBG on Windows 8

In Windows 8, WinDBG is included in the Windows Driver Kit (WDK). You can install Visual Studio and the WDK, or install the Debugging Tools for Windows 8.1 package separately, which includes WinDBG.
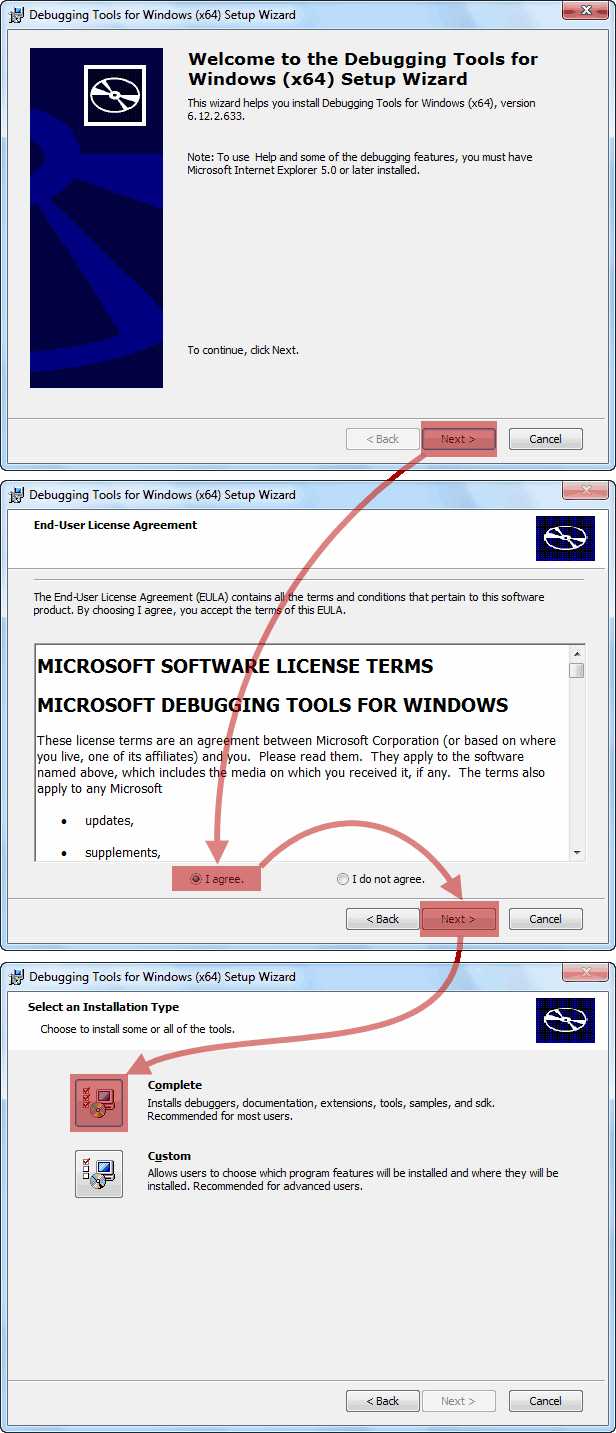
The installer will ask if you want to install WinDBG locally or download the entire development package for another computer. The latter is essentially the equivalent offline installer, which is very convenient if you want to install the package on other systems in the future.

Figure 1: Selecting Installation Type
In the next window, you need to uncheck all the items except “Debugging Tools for Windows” and click on the “Download” button.
Once the installer has finished its work, go to the directory where the package was downloaded (by default it is c:\Users\Username\Downloads\Windows Kits\8.1\StandaloneSDK) and go through the installation procedure.
Installing WinDBG on Windows 7 and earlier
For Windows 7 and earlier, WinDBG is part of the "Debugging Tools for Windows" package that is included with the Windows SDK and .Net Framework. You will be required to download the installer and then select “Debugging Tools for Windows” during the installation process.
During installation, I select the "Debugging Tools" option under "Redistributable Packages" to create a standalone installer to make future installations easier.

Figure 2: Selecting installation options to create a standalone installer
Once the installation is complete, you should have WinDBG installers for various platforms (in the c:\Program Files\Microsoft SDKs\Windows\v7.1\Redist\Debugging Tools for Windows\ directory).

Figure 3: Folder with WinDBG installers for various platforms
WinDBG Interface

Figure 4: WinDBG appearance
The first time you see appearance WinDGB, you will realize that the debugger is frighteningly simple. Most WinDBG functions are learned during process debugging. Instead of spending time describing the interface, in the following sections we will cover only the most important points.
The most basic thing you need to know about the debugger interface is the command window, which consists of two areas. First area: a window where the result of command execution is displayed. Second area: a small text field for entering commands.

Figure 5: WinDBG Command Window
Symbols
In most cases, WinDBG does not require any special settings and works correctly out of the box. But one important thing that needs to be configured is the characters. Symbols are files that are generated along with the executable file when a program is compiled and contain debugging information (functions and variable names). Debug information allows you to examine the functionality of an application while debugging or disassembling. Many Microsoft components are compiled with symbols that are distributed through the Microsoft Symbol Server. With the rest of the executable files, everything is not so rosy - very rarely files with debug information are included with the application. In most cases, companies restrict access to such information.
To configure WinDBG to use Microsoft Symbol Server, go to File:Symbol File Path and set the path to SRV*C:\Symbols*http://msdl.microsoft.com/download/symbols. Of course, it's a little strange that asterisks are used as a separator. After you set up Microsoft Symbol Server, the symbols will be downloaded to the C:\Symbols folder.

Figure 6: Setting up Microsoft Symbol Server
WinDBG will automatically load symbols for binary files when needed. You can also add your own symbols folder, like this:
SRV*C:\Symbols*http://msdl.microsoft.com/download/symbols;c:\SomeOtherSymbolFolder
Adding symbols while debugging
If you need to import symbols while debugging, you can do this using .sympath (a command window will appear when you hook into the process). For example, to add the c:\SomeOtherSymbolFolder folder, enter the following command:
0:025> .sympath+ c:\SomeOtherSymbolFolder
Symbol search path is: SRV*C:\Symbols*http://msdl.microsoft.com/download/symbols;c:\SomeOtherSymbolFolder
Expanded Symbol search path is: srv*c:\symbols*http://msdl.microsoft.com/download/symbols;c:\someothersymbolfolder
It's a good idea to reload the symbols after adding or changing paths:
0:025> .reload
Reloading current modules
................................................................
...............................................
Checking loaded symbols
To see which modules have symbols loaded, you can use the x*! command. Although WinDBG only loads symbols as needed, the x*! will show the symbols that can be loaded. You can force the symbols to be loaded using the ld * command (this may take a while, and you can stop the process by going to Debug:Break).

Now we can see the symbols for each module.

Figure 8: List of symbols
Debugging a local process
When debugging a local process, you have two options:
- Hook onto an already running process.
- Start the process via WinDBG.
Each method has its own advantages and disadvantages. If, say, you run a program through WinDBG, then you have access to some special debugging options (for example, heap debugging) that can cause the application to crash. On the other hand, there are also programs that crash when you attach a debugger to them. Some applications (especially malware) check for the presence of a debugger in the system during startup and, accordingly, in this case it makes sense to cling to an already running process. Sometimes you are debugging a Windows service that sets some parameters during startup, so to simplify the debugging process, it is also better to hook into a running process rather than running the service through a debugger. Some people claim that running a process through a debugger has a serious impact on performance. In short, try both and choose what suits you best. If for some reason you prefer a particular method, share your thoughts in the comments!
Starting the process
If you're debugging a standalone application that runs locally and doesn't communicate with the network, you might want to run it through WinDBG. However, this does not mean that you cannot hook into an already running process. Choose the method that is most convenient for you.
Starting the process is not difficult. Go to "File:Open Executable" and select the executable file you want to debug. You can also specify arguments or set the starting directory:
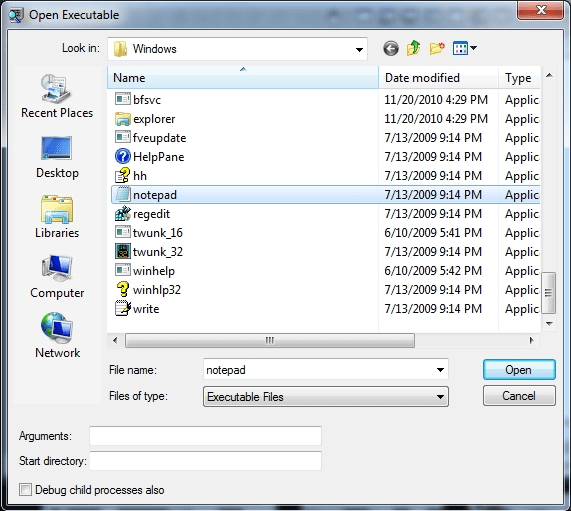
Figure 9: Selection executable file for debugging
Process connection
Connecting to an already running process is also not difficult. However, be aware that in some cases it may take time to find the exact process you want to debug. For example, some browsers create one parent process and then several more processes for each tab. So, depending on the crash dump you are debugging, you might want to hook into the process associated with the tab rather than the parent process.
To attach to an already running process, go to “File:Attach to a Process” and then select the PID or name of the process. Remember that you must have the appropriate rights to join the process.

Figure 10: Selecting the process to hook into
If, after connecting, the application pauses its operation, you can use the “Noninvaise” mode by checking the appropriate box.
Debugging a remote process
You may sometimes need to debug a process on a remote system. It would be much more convenient to solve this problem using a local debugger, instead of using virtual machine or RDP. Or perhaps you are debugging the LoginUI.exe process, which is only accessible when the system is locked. In situations like these, you can use a local version of WinDBG and connect to processes remotely. There are two most common ways to solve these problems.
Existing debug sessions
If you have already started debugging a program locally (by connecting or running a process through WinDBG), you can enter a specific command and WinDBG will launch a “listener” that the remote debugger can connect to. To do this, use the .server command:
Server tcp:port=5005
After running the above command, you may see a warning like this:

Figure 11: Warning message that may appear after running the command to create a listener
WinDBG will then report that the server is running:
0:005> .server tcp:port=5005
0:
You can now connect from a remote host to an existing debug session by going to “File:Connect to a Remote Session” and entering something like the following into the text field: tcp:Port=5005,Server=192.168.127.138

Figure 12: Remote connection to a debug session
Once connected, you will receive confirmation on the remote client:
Server started. Client can connect with any of these command lines
0:
MACHINENAME\User (tcp 192.168.127.138:13334) connected at Mon Dec 16 09:03:03 2013
and the message in the local version of the debugger:
MACHINENAME\User (tcp 192.168.127.138:13334) connected at Mon Dec 16 09:03:03 2013
Creating a remote server
You can also create a separate server with WinDBG, connect to it remotely and select a process to debug. This can be done by using the dbgsrv.exe file where you plan to debug processes. To start such a server, run the following command:
dbgsrv.exe -t tcp:port=5005

Figure 13: Starting a remote server
Again, you may receive a security warning that you should accept:

Figure 14: Security message that may appear during startup of the debug server
You can connect to the debug server by going to File: Connect to Remote Stub and entering the following line into the text field: tcp:Port=5005,Server=192.168.127.138

Figure 15: Connecting to the debug server
Once connected, you will not receive any signals that you have connected, but if you go to “File:Attach to a Process”, you will see a list of debug server processes (where dbgsrv.exe is running). Now you can hook into the process as if you were doing it locally.
Help system
The help system in WinDBG is great. In addition to learning something new, you should be able to get background information about a command. Use the .hh command to access WinDBG Help:
You can also get help information for a specific command. For example, to get help with the .reload command, use the following command:
windbg> .hh .reload
Or just go to the Help:Contents section.
Modules
While the program is running, various modules are imported to provide the functionality of the application. Therefore, if you know which modules are imported by the application, you can better understand how it works. In many cases, you will be debugging the specific module loaded by the program, rather than the executable file itself.
Once connected to the process, WinDBG will automatically display the loaded modules. For example, below are the modules after I connected to calc.exe:
Microsoft (R) Windows Debugger Version 6.12.0002.633 X86
Copyright (c) Microsoft Corporation. All rights reserved.
*** wait with pending attach
Symbol search path is: SRV*C:\Symbols*http://msdl.microsoft.com/download/symbols
Executable search path is:
ModLoad: 00a70000 00b30000 C:\Windows\system32\calc.exe
ModLoad: 77630000 7776c000 C:\Windows\SYSTEM32\ntdll.dll
ModLoad: 77550000 77624000 C:\Windows\system32\kernel32.dll
ModLoad: 75920000 7596a000 C:\Windows\system32\KERNELBASE.dll
ModLoad: 76410000 77059000 C:\Windows\system32\SHELL32.dll
ModLoad: 77240000 772ec000 C:\Windows\system32\msvcrt.dll
ModLoad: 76300000 76357000 C:\Windows\system32\SHLWAPI.dll
ModLoad: 75cd0000 75d1e000 C:\Windows\system32\GDI32.dll
ModLoad: 75fa0000 76069000 C:\Windows\system32\USER32.dll
ModLoad: 777b0000 777ba000 C:\Windows\system32\LPK.dll
ModLoad: 774b0000 7754d000 C:\Windows\system32\USP10.dll
ModLoad: 73110000 732a0000 C:\Windows\WinSxS\x86_microsoft.windows.gdiplus_
6595b64144ccf1df_1.1.7600.16385_none_72fc7cbf861225ca\gdiplus.dll
ModLoad: 75a80000 75bdc000 C:\Windows\system32\ole32.dll
ModLoad: 76360000 76401000 C:\Windows\system32\RPCRT4.dll
ModLoad: 777c0000 77860000 C:\Windows\system32\ADVAPI32.dll
ModLoad: 75be0000 75bf9000 C:\Windows\SYSTEM32\sechost.dll
ModLoad: 76270000 762ff000 C:\Windows\system32\OLEAUT32.dll
ModLoad: 74590000 745d0000 C:\Windows\system32\UxTheme.dll
ModLoad: 74710000 748ae000 C:\Windows\WinSxS\x86_microsoft.windows.common-
ModLoad: 703d0000 70402000 C:\Windows\system32\WINMM.dll
ModLoad: 74c80000 74c89000 C:\Windows\system32\VERSION.dll
ModLoad: 77770000 7778f000 C:\Windows\system32\IMM32.DLL
ModLoad: 75c00000 75ccc000 C:\Windows\system32\MSCTF.dll
ModLoad: 74130000 7422b000 C:\Windows\system32\WindowsCodecs.dll
ModLoad: 74260000 74273000 C:\Windows\system32\dwmapi.dll
ModLoad: 756d0000 756dc000 C:\Windows\system32\CRYPTBASE.dll
ModLoad: 75e60000 75ee3000 C:\Windows\system32\CLBCatQ.DLL
ModLoad: 6ef10000 6ef4c000 C:\Windows\system32\oleacc.dll
Later in the debugging process, you can display this list again using the lmf command:
0:005>lmf
start end module name
00a70000 00b30000 calc C:\Windows\system32\calc.exe
6ef10000 6ef4c000 oleacc C:\Windows\system32\oleacc.dll
703d0000 70402000 WINMM C:\Windows\system32\WINMM.dll
73110000 732a0000 gdiplus C:\Windows\WinSxS\x86_microsoft.windows.gdiplus_6595b64144ccf1df_
1.1.7600.16385_none_72fc7cbf861225ca\gdiplus.dll
74130000 7422b000 WindowsCodecs C:\Windows\system32\WindowsCodecs.dll
74260000 74273000 dwmapi C:\Windows\system32\dwmapi.dll
74590000 745d0000 UxTheme C:\Windows\system32\UxTheme.dll
74710000 748ae000 COMCTL32 C:\Windows\WinSxS\x86_microsoft.windows.common-
controls_6595b64144ccf1df_6.0.7600.16385_none_421189da2b7fabfc\COMCTL32.dll
74c80000 74c89000 VERSION C:\Windows\system32\VERSION.dll
756d0000 756dc000 CRYPTBASE C:\Windows\system32\CRYPTBASE.dll
75920000 7596a000 KERNELBASE C:\Windows\system32\KERNELBASE.dll
75a80000 75bdc000 ole32 C:\Windows\system32\ole32.dll
75be0000 75bf9000 sechost C:\Windows\SYSTEM32\sechost.dll
75c00000 75ccc000 MSCTF C:\Windows\system32\MSCTF.dll
75cd0000 75d1e000 GDI32 C:\Windows\system32\GDI32.dll
75e60000 75ee3000 CLBCatQ C:\Windows\system32\CLBCatQ.DLL
75fa0000 76069000 USER32 C:\Windows\system32\USER32.dll
76270000 762ff000 OLEAUT32 C:\Windows\system32\OLEAUT32.dll
76300000 76357000 SHLWAPI C:\Windows\system32\SHLWAPI.dll
76360000 76401000 RPCRT4 C:\Windows\system32\RPCRT4.dll
76410000 77059000 SHELL32 C:\Windows\system32\SHELL32.dll
77240000 772ec000 msvcrt C:\Windows\system32\msvcrt.dll
774b0000 7754d000 USP10 C:\Windows\system32\USP10.dll
77550000 77624000 kernel32 C:\Windows\system32\kernel32.dll
77630000 7776c000 ntdll C:\Windows\SYSTEM32\ntdll.dll
77770000 7778f000 IMM32 C:\Windows\system32\IMM32.DLL
777b0000 777ba000 LPK C:\Windows\system32\LPK.dll
777c0000 77860000 ADVAPI32 C:\Windows\system32\ADVAPI32.dll
You can also find out the loading address for a specific module using the “lmf m” command:
0:005> lmf m kernel32
start end module name
77550000 77624000 kernel32 C:\Windows\system32\kernel32.dll
You can also get information about the image header of a particular module using the!dh extension ( Exclamation point indicates an extension):
0:005> !dh kernel32
File Type: DLL
FILE HEADER VALUES
14C machine (i386)
4 number of sections
4A5BDAAD time date stamp Mon Jul 13 21:09:01 2009
0 file pointer to symbol table
0 number of symbols
E0 size of optional header
2102 characteristics
Executable
32 bit word machine
DLL
OPTIONAL HEADER VALUES
10B magic #
9.00 linker version
C4600 size of code
C800 size of initialized data
0 size of uninitialized data
510C5 address of entry point
1000 base code
----- new -----
77550000 image base
1000 section alignment
200 file alignment
3 subsystem (Windows CUI)
6.01 operating system version
6.01 image version
6.01 subsystem version
D4000 size of image
800 size of headers
D5597 checksum
00040000 size of stack reserve
00001000 size of stack commit
00100000 size of heap reserve
00001000 size of heap commit
140 DLL characteristics
Dynamic base
NX compatible
B4DA8 [ A915] address of Export Directory
BF6C0 [ 1F4] address of Import Directory
C7000 [520] address of Resource Directory
0 [ 0] address of Exception Directory
0 [ 0] address of Security Directory
C8000 [B098] address of Base Relocation Directory
C5460 [ 38] address of Debug Directory
0 [ 0] address of Description Directory
0 [ 0] address of Special Directory
0 [ 0] address of Thread Storage Directory
816B8 [ 40] address of Load Configuration Directory
278 [408] address of Bound Import Directory
1000 [DE8] address of Import Address Table Directory
0 [ 0] address of Delay Import Directory
0 [ 0] address of COR20 Header Directory
0 [ 0] address of Reserved Directory
SECTION HEADER #1
.text name
C44C1 virtual size
1000 virtual address
C4600 size of raw data
800 file pointer to raw data
0 number of relocations
0 number of line numbers
60000020 flags
Code
(no align specified)
Execute Read
Debug Directories(2)
Type Size Address Pointer
cv 25 c549c c4c9c Format: RSDS, guid, 2, kernel32.pdb
(10) 4 c5498 c4c98
SECTION HEADER #2
.data name
FEC virtual size
C6000 virtual address
E00 size of raw data
C4E00 file pointer to raw data
0 file pointer to relocation table
0 file pointer to line numbers
0 number of relocations
0 number of line numbers
C0000040 flags
Initialized Data
(no align specified)
Read Write
SECTION HEADER #3
.rsrc name
520 virtual size
C7000 virtual address
600 size of raw data
C5C00 file pointer to raw data
0 file pointer to relocation table
0 file pointer to line numbers
0 number of relocations
0 number of line numbers
40000040 flags
Initialized Data
(no align specified)
Read Only
SECTION HEADER #4
.reloc name
B098 virtual size
C8000 virtual address
B200 size of raw data
C6200 file pointer to raw data
0 file pointer to relocation table
0 file pointer to line numbers
0 number of relocations
0 number of line numbers
42000040 flags
Initialized Data
Discardable
(no align specified)
Read Only
Messages and Exceptions
After connecting to a process, a list of modules is first displayed, and then other messages may appear. For example, when we hook into calc.exe, WinDBG automatically sets a breakpoint (which is simply a marker used to stop the application). Breakpoint information is displayed on the screen:
(da8.b44): Break instruction exception - code 80000003 (first chance)
This particular message is an exception, namely a first-chance exception. Essentially, an exception is a special condition that occurs during the execution of a program. A first-chance exception means that the program stopped immediately after the exception occurred. Second-chance exception means that after the exception occurs, some operations will be performed, and then the program will stop working.
Registers
After displaying messages and exceptions, the debugger displays the state of the processor registers. Registers are special variables inside the processor that store small pieces of information or monitor the state of something in memory. The processor can process the information in these registers very quickly. This is much faster than getting information over the bus from RAM every time.
After connecting to calc.exe, WinDBG automatically displays information about the following registers:
eax=7ffd9000 ebx=00000000 ecx=00000000 edx=776cd23d esi=00000000 edi=00000000
cs=001b ss=0023 ds=0023 es=0023 fs=003b gs=0000 efl=00000246
You can duplicate this information again later using the r command:
0:005>r
eax=7ffd9000 ebx=00000000 ecx=00000000 edx=776cd23d esi=00000000 edi=00000000
eip=77663540 esp=02affd9c ebp=02affdc8 iopl=0 nv up ei pl zr na pe nc
cs=001b ss=0023 ds=0023 es=0023 fs=003b gs=0000 efl=00000246
ntdll!DbgBreakPoint:
77663540 cc int 3
If we want to get the value of a specific register, we can run the following command:
0:005> r eax
eax=7ffd9000
Information can be obtained simultaneously from several registers as follows:
0:005> r eax,ebp
eax=7ffd9000 ebp=02affdc8
Pointer to instruction
The last command is about the instructions to run. Here the information is also displayed on the screen, as in the case of the r command, of what the EIP register contains. EIP is a register that contains the location of the next instruction to be executed by the processor. What WinDBG displays is the equivalent of the command u eip L1, after which WinDBG goes to the address specified in the EIP register, converts this section into assembly code and displays it on the screen.
ntdll!DbgBreakPoint:
77663540 cc int 3
stay in touch
In future articles, we'll look at how to use WinDBG in the field: breakpoints, step-by-step debugging, and memory browsing. Don't switch! J.
Debugging Tools for Windows- Operating code debugging tools Windows systems. They are a set of freely distributed programs from Microsoft designed for debugging user mode and kernel mode code: applications, drivers, services, kernel modules. The toolkit includes console and GUI mode debuggers, utilities for working with symbols, files, processes, and utilities for remote debugging. The toolkit contains utilities that can be used to find the causes of failures in various system components. Debugging Tools for Windows from a certain point onwards are not available for download in the form of a stand-alone distribution and are part of the Windows SDK (Windows Software Development Kit). Set of instrumental Windows tools The SDK, in turn, is available as part of the MSDN subscription program or can be freely downloaded as a separate distribution from msdn.microsoft.com. According to the developers, the latest and most current version Debugging Tools for Windows is contained specifically in the Windows SDK.
Debugging Tools for Windows are updated and made publicly available quite often and this process does not depend in any way on the release of operating systems. Therefore, check periodically for new versions.
Let's now see what, in particular, the Debugging Tools for Microsoft Windows:
- Debug local applications, services, drivers and kernel;
- Debug remote applications, services, drivers and kernel over the network;
- Debug running applications in real time;
- Analyze memory dump files of applications, the kernel and the system as a whole;
- Work with systems based on x86/x64/Itanium architectures;
- Debug user mode and kernel mode programs;
The following versions of Debugging Tools for Windows are available: 32-bit x86, Intel Itanium, 64-bit x64. We will need two of them: x86 or x64.
There are several ways to install Debugging Tools for Windows; in this article we will consider only the main ones:
- Installation via web installer.
- Installing Debugging Tools for Windows from ISO Windows image SDK.
- Installing Debugging Tools for Windows directly from the dbg_amd64.msi / dbg_x86.msi packages.
It remains unclear at what point, why should I install debugging tools on my computer? Often you are faced with a situation where interference in the work environment is extremely undesirable! And even more so, installing a new product, that is, making changes to the registry/system files, may be completely unacceptable. Examples include mission-critical servers. Why don't developers consider the option of portable versions of applications that do not require installation?
From version to version, the installation process of the Debugging Tools for Windows package undergoes some changes. Let's now move directly to the installation process and look at the ways in which you can install the toolkit.
Installing Debugging Tools for Windows using the web installer
Go to the Windows SDK Archive page and find a section called Windows 10 and below the item “Windows 10 SDK (10586) and device emulator with Windows 10 Mobile (Microsoft) (version 10586.11)”.
Click on the item INSTALL SDK. After clicking, download and run the file sdksetup.exe, which initiates the online installation process of the Windows SDK. At the initial stage, the installer will check whether the .NET Framework package is installed on the system latest version(V this moment this is 4.5). If the package is missing, installation will be offered and the station will reboot upon completion. Immediately after the reboot, at the user authorization stage, the installation process of the Windows SDK itself starts.

Often, when selecting all components of a package without exception, errors may occur during the installation process. In this case, it is recommended to install components selectively, the minimum required set.
After installation of Debugging Tools for Windows is complete, the location of the debugging files when this method Our installation will be as follows:
- 64-bit versions: C:\Program Files (x86)\Windows Kits\x.x\Debuggers\x64
- 32-bit versions: C:\Program Files (x86)\Windows Kits\x.x\Debuggers\x86
* where x.x is a specific version of the development kit;
We noticed that versions 8 and higher, the installation paths are noticeably different from the classic ones for everyone previous versions Debugging tools?
A huge plus this method Installing Debugging Tools for Windows involves installing versions of debugging tools for all architectures at once.
Installing Debugging Tools for Windows from the Windows SDK ISO
This method involves installing Debugging Tools for Windows using the full Windows SDK (Software Developers Kit) installation image. Until a certain time, download ISO image for the corresponding system it was possible on the Windows SDK Archive page. However, at the moment, you can get an ISO image of the SDK by running the web installer sdksetup.exe and selecting Download the Windows Software Development Kit in the installer start window:
As we found out, the previous installation method using a web installer is quite capricious and often ends in error. On clean systems it installs without problems, but on sufficiently loaded systems numerous problems arise. If this is your case, then use this method.
Accordingly, on the page you need to select the required distribution, for me (and I think for many) at the moment it is “Windows SDK for Windows 7 and .NET Framework 4” and just below click on the link “Get an ISO image of a DVD” .
When working with the site msdn.microsoft.com, I recommend using a browser Internet Explorer, since there have been cases of competing products not working!
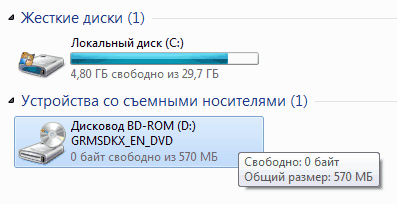
Accordingly, it is necessary to choose solely according to necessity. Typically, the bitness of Debugging Tools for Windows matches the bitness of the system. My systems are mostly 64-bit, so in most cases I download the image for a 64-bit system GRMSDKX_EN_DVD.iso.
Then, after downloading the image, we need to somehow work with the existing ISO image. The traditional method is, of course, to burn a CD, but this is a rather long and sometimes expensive method. I suggest using free utilities to create virtual disk devices in the system. Personally, I prefer to use DEAMON Tools Lite for this purpose. Someone may have other preferences, more direct or lightweight utilities, depending on taste and color, as they say .. After installing DAEMON Tools Lite, I simply double-click on the image file GRMSDKX_EN_DVD.iso and a new virtual one appears in the system CD:
Then, by double-clicking, I activate autoload and start the Windows SDK installation:

When it’s time to select components to install from the list, we disable absolutely all options except those marked in the screenshot. This will help us avoid unnecessary mistakes now.

Everything is exactly like that, in the screenshot there are two options marked: “Windows Performance Toolkit” and “Debugging Tools for Windows”. Choose both, because Windows Performance Toolkit will certainly come in handy in your work! Then, after clicking the "Next" button, the installation continues as usual. And at the end you will see the inscription “Installation Complete”.
Upon completion of installation, the working directories of the Debugging Tools for Windows package will be as follows:
- For x86 version:
- For x64 version:
At this point, the installation of Debugging Tools for Windows can be considered complete.
Installing Debugging Tools for Windows via .msi file
If problems arise when installing Debugging Tools for Windows using the two previous methods, we still have one more in stock, the most reliable and time-tested, which has come to the rescue, so to speak, more than once. Once upon a time, before integration into the Windows SDK, Debugging Tools for Windows were available as a separate installer.msi, which can still be found, but already in the bowels of the Windows SDK distribution. Since we already have an ISO image of the Windows SDK in our hands, we can not mount it into the system, but simply open it using the already well-known WinRAR archiver, or any other product that works with the contents of ISO disks.

After opening the image, we need to go to the “Setup” directory located in the root and then select one of the directories:
- To install the 64-bit version: \Setup\WinSDKDebuggingTools_amd64 and unpack the dbg_amd64.msi file from this directory.
- To install the 32-bit version: \Setup\WinSDKDebuggingTools and unpack the dbg_x86.msi file from this directory.
Upon completion of installation, the working directories of the Debugging Tools for Windows package will be as follows:
- For x86 version: C:\Program Files (x86)\Debugging Tools for Windows (x86)
- For x64 version: C:\Program Files\Debugging Tools for Windows (x64)
At this point, the installation of Debugging Tools for Windows can be considered complete.
additional information
I don’t know what this is connected with, maybe due to my carelessness, but after installing Debugging Tools for Windows, the installer does not set the path to the directory with the debugger in the system path variable Path. This imposes certain restrictions on launching various debugging tasks directly from the console. Therefore, if there is no path, I independently write in the window Environment Variables path to debugging tools:
- C:\Program Files (x86)\Windows Kits\10\Debuggers\x86
- C:\Program Files (x86)\Windows Kits\10\Debuggers\x64
* In your case, the paths may differ both due to the use of an OS of a different bit size, and due to the use of a different SDK version.
The utilities of the Debugging Tools for Windows package can work as portable applications; you just need to copy the directory from the working system Microsoft Windows Performance Toolkit and use it as a portable version on a production server. But do not forget to take into account the system capacity!! Even if you have completed a complete installation of the package on a critical system, you can start working right after installation, no reboot is required.
Composition of Debugging Tools for Windows
And now, finally, here is the composition of Debugging Tools for Windows:
| File | Purpose |
|---|---|
| adplus.doc | Documentation for the ADPlus utility. |
| adplus.exe | A console application that automates the work of the cdb debugger to create dumps and log files for one or more processes. |
| agestore.exe | A utility for removing obsolete files from storage used by a symbol server or source server. |
| breakin.exe | A utility that allows you to send a custom break combination to processes, similar to pressing CTRL+C. |
| cdb.exe | User mode console debugger. |
| convertstore.exe | A utility for converting symbols from 2-tier to 3-tier. |
| dbengprx.exe | Repeater (proxy server) for remote debugging. |
| dbgrpc.exe | A utility for displaying RPC call status information. |
| dbgsrv.exe | Server process used for remote debugging. |
| dbh.exe | A utility for displaying information about the contents of a symbol file. |
| dumpchk.exe | Dump checking utility. A utility for quickly checking a dump file. |
| dumpexam.exe | A utility for analyzing a memory dump. The result is output to %SystemRoot%\MEMORY.TXT . |
| gflags.exe | Editor of global system flags. The utility manages registry keys and other settings. |
| i386kd.exe | Wrapper for kd. Was that what kd was once called for systems based on Windows NT/2000 for x86 machines? Probably left for compatibility reasons. |
| ia64kd.exe | Wrapper for kd. Was it once called kd for systems based on Windows NT/2000 for ia64 machines? Probably left for compatibility reasons. |
| kd.exe | Kernel mode console debugger. |
| kdbgctrl.exe | Kernel debugging management tool. A utility for managing and configuring kernel debugging connection. |
| kdsrv.exe | Connection server for KD. The utility is a small application that runs and waits for remote connections. kd runs on the client and connects to this server for remote debugging. Both the server and client must be from the same Debugging Tools assembly. |
| kill.exe | A utility for ending processes. |
| list.exe | A utility for displaying the contents of a file on the screen. This miniature utility was included with one purpose - viewing large text or log files. It takes up little memory space because it loads the text in parts. |
| logger.exe | A miniature debugger that can only work with one process. The utility injects logexts.dll into process space, which records all function calls and other actions of the program under study. |
| logviewer.exe | A utility for viewing logs recorded by the logger.exe debugger. |
| ntsd.exe | Microsoft NT Symbolic Debugger (NTSD). A debugger identical to cdb except that it creates a text window when launched. Like cdb, ntsd is capable of debugging both console applications and graphical applications. |
| pdbcopy.exe | A utility for removing private symbols from a symbol file, controlling public symbols included in the symbol file. |
| remote.exe | A utility for remote debugging and remote control of any console debugger KD, CDB and NTSD. Allows you to run all these console debuggers remotely. |
| rtlist.exe | Remote task viewer. The utility is used to display a list of running processes through the DbgSrv server process. |
| symchk.exe | A utility for downloading symbols from the Microsoft symbol server and creating a local symbol cache. |
| symstore.exe | A utility for creating a network or local symbol storage (2-tier/3-tier). Symbol storage is a specialized directory on disk, which is built in accordance with a specific structure and contains symbols. A structure of subfolders with names identical to the names of the components is created in the root directory of symbols. In turn, each of these subfolders contains nested subfolders that have special names obtained by hashing binary files. The symstore utility scans component folders and adds new components to the symbol store, where any client can retrieve them. It is said that symstore is used to receive symbols from 0-tier storage and put them into 2-tier/3-tier storage. |
| tlist.exe | Task viewer. A utility for displaying a list of all running processes. |
| umdh.exe | User-mode dump heap utility. A utility for analyzing heaps of the selected process. Allows you to display various parameters for the heap. |
| usbview.exe | USB Viewer. A utility for viewing USB devices connected to a computer. |
| vmdemux.exe | Virtual machine demultiplexer. Creates several named pipes for one COM connection. Channels are used to debug various virtual machine components |
| windbg.exe | User mode and kernel mode debugger with GUI. |
To identify the causes blue screens(BSOD) a memory dump analysis is required. In the vast majority of cases, a minidump, which is created by the system in case of critical errors, is sufficient.
This article contains step-by-step instruction on installing and configuring WinDBG - a powerful debugging tool that allows you to identify the true cause of BSOD.
Step 1 - Configuring Small Memory Dumps
Step 2 - Installing WinDBG
To analyze memory dumps, you will need to install the WinDBG debugger, which is included in the Windows SDK. At the time of writing, the latest available Windows versions SDK:
- Windows 10 SDK (network installer download)
- Windows 8.1 SDK (network installer download)

Step 3 - Mapping .dmp Files to WinDBG
To make reading and analyzing memory dumps easier, map .dmp files to WinDBG. This will allow you to open dump files from Explorer directly in WinDBG without first launching it.

Step 4 — Setting up a symbol server to receive debug symbol files

Installation and initial configuration of WinDBG is complete. In order to change its appearance, you can go to the menu View- you will find font settings by selecting Font, and the console window settings in Options.


